


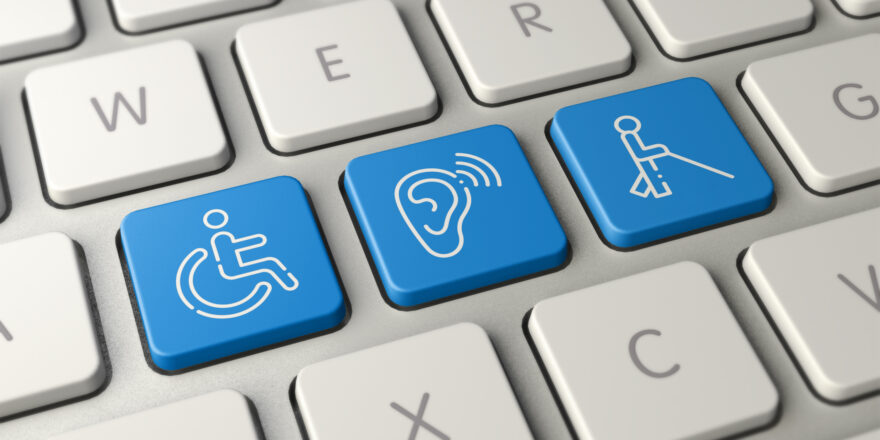
Izdavanje potvrda za osobe s invaliditetom
Obavještavamo cijenjene osobe s invaliditetom o tome da prilikom podnošenja zahtjeva za priznavanje prava u sustavu socijalne skrbi za koje…
Obavještavamo cijenjene osobe s invaliditetom o tome da prilikom podnošenja zahtjeva za priznavanje prava u sustavu socijalne skrbi za koje…

Pri Hrvatskom zavodu za javno zdravstvo započela je s radom Info linija za ovisnosti koja je namijenjena pružanju informacija građanima…

Dana 1. veljače 2024. počela je provedba Posebnog programa za probir i rano otkrivanje raka prostate u Hrvatskoj. Program se…

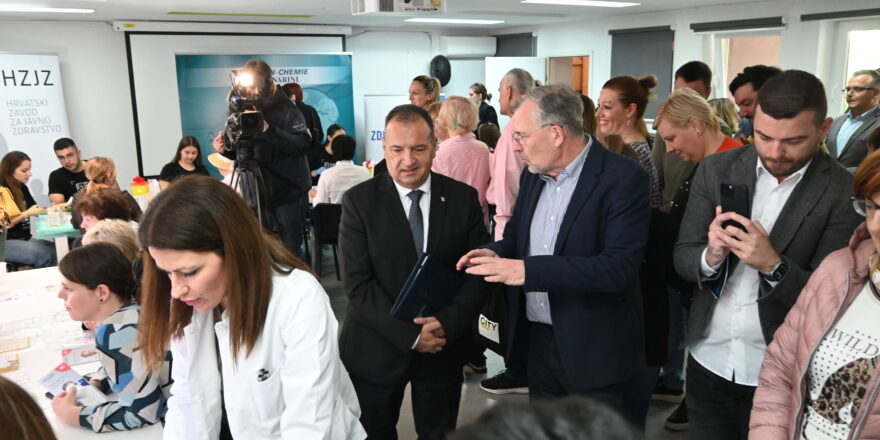
Odjel za izravnu virološku dijagnostiku te Odjel za genotipizaciju pri Hrvatskom Zavodu za javno zdravstvo (HZJZ) u sklopu kojih djeluje…
Prema podacima Registra zaraznih bolesti Službe za epidemiologiju zaraznih bolesti, u periodu od 1.1.2023. do 26.04.2024. godine, zaprimili smo 6473…
26. travnja 2024.
Europski tjedan cijepljenja tradicionalno se svake godine obilježava u zadnjem tjednu travnja, ove godine od 21. do 27. travnja. U…
25. travnja 2024.
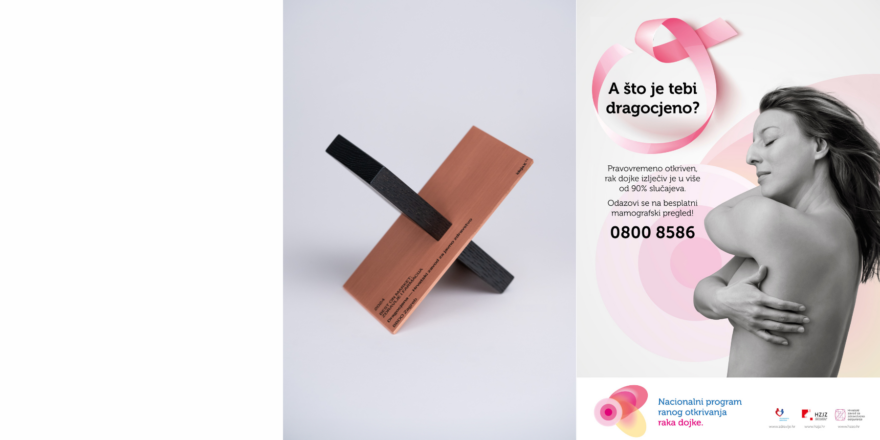
Nova promotivna kampanja za Nacionalni program ranog otkrivanja raka dojke – “Dragocjena”, nastala je u suradnji Hrvatskog zavoda za javno…
25. travnja 2024.
U organizaciji znanstveno-stručnog časopisa „Sigurnost“ i ZIRS Učilišta – ustanove za obrazovanje odraslih, u Zagrebu će se 5. prosinca 2024….
25. travnja 2024.

Hrvatski zavod za javno zdravstvo osposobljen je prema zahtjevima norme HR EN ISO/IEC 17025:2007 za ispitivanje vode, hrane, hrane za životinje...

Mikrobiološka djelatnost HZJZ-a je prva takva djelatnost osnovana u Hrvatskoj koncem 19. i početkom prošlog stoljeća...

Tečaj je reguliran Zakonom o zaštiti pučanstva od zaraznih bolesti (N.N. br.: 79/07, 113/08, 43/09 i 130/17) i Pravilnikom o načinu i programu...

Zdravstveni pregledi osoba koje podliježu obveznom zdravstvenom nadzoru, prema Zakonu o zaštiti pučanstva od zaraznih bolesti...

U savjetovalište mogu doći svi zainteresirani građani. Testirati se mogu punoljetne osobe (18 godina i više)...

U Savjetovalištu građani mogu dobiti uslugu psihoedukacije, psihološke prve pomoći, kratke savjetodavne intervencije, procjenu rizika te izradu plana.

Savjetovalište za pravilnu prehranu i tjelesnu aktivnost svojim korisnicima pruža usluge savjetovanja o pravilnoj prehrani i tjelesnoj aktivnosti...